Arthur Noxon speaks at Burning Amp Festival 2023
Sept. 2023 View as PDF
Audio equipment, including amps and speakers, even listening rooms are at the very least always tested with a frequency sweep to get the dB vs frequency response curve. Lying buried, unseen below these response curves, are additional response curves that if known would provide additional information about the performance of the audio equipment.The most well-known of these hidden curves is the steady state background noise floor. With amps and speakers another of these “hidden” curves in Harmonic Distortion. In Room Acoustics it is Dynamic Distortion.
To reveal these otherwise hidden distortions additional tests are required. In the electronic side of audio, amps and speakers, the self-induced noise is Harmonic Distortion HD, upper partials of the fundamental tone being played which add to and distort the audible quality of the original signal. On the acoustic side of audio, the listening room is the component. The self-induced noise is Running Reverb, the buildup of early reflections and reverberation.
The Sweep-tuned and the Multi-tone analyzers reveal Harmonic Distortion in audio gear. A hybrid of Sweep-tuned and Multi-tone analyzer methods was utilized to reveal the presence of Dynamic Distortion in the audio signal as it passes from the speaker to the listener in the listening room.
This paper reviews the Sweep and Multi-tone detection of the self-induced noise response curves used in the electronic side of audio. Then it introduces a hybrid version of these two testing methods along with a necessary modification which enables acoustic testing in the sound level time domain that reveals the self-induced acoustic noise response curve. The difference is that in multi-tone testing the tones are presented all at one time. Here they are presented one at a time by the sine sweep, which was modified from a smooth log sweep to a gated linear sweep for low frequency work.
Watch ASC President and founder speak about Dynamic Distortion at Burning Amp Festival 2023
Frequency Response Curves
The Frequency Response Curve, FRC is the most common test in audio. Every processor, amp, speaker, interconnect and listening room gets a frequency-sweep test.

Hidden far below the FRC lies a band of background noise, transformer hum, tube and transistor hiss. Sometimes this is measured and added to the FRC to show how low the background noise floor is below the level of the FRC. Another noise usually comes up whenever a signal is being passed through a piece of gear. This self-generated noise is usually harmonic distortion on the electronic side of the audio chain, and it is acoustic distortion on the acoustic side of the audio chain.
What the FRC does not reveal is the presence and level of these bands of self-induced noise that are being added to the signal path. However, on the electronic side there are harmonic distortion analyzers, sweep-tone and multi-tone analyzers that map out these types of self-induced distortion bands.
On the acoustic side, it’s a different story. Acoustic distortion is created in the space between the speaker and the listener, in the listening room. But what is acoustic distortion and how is it measured?
There are acoustic tests beside FRC. The RTA real time analyzer shows the spectrum of sound at any given moment. The ETF energy time frequency shows the waterfall spectral decay of sound. But these don’t define or measure acoustic distortion.
Music is not a steady state sound. It is a sound that rapidly varies in frequency and loudness. A simplified version of music can be boiled down to a series of tone/chord bursts. Musical quality is assessed by comparing what is heard at the listening position to what the speaker delivered to the room.
There are two parts to musicality, one is hearing each of the complex tones and the other is hearing the rapidity of their coming and going, essentially the variation in loudness of the tones being heard, dynamic level fluctuation. When a speaker plays a sound, that sound is quickly heard all over the room.
The issue of musicality is not that we don’t hear the musical sound as it was originally sounded. It’s when we can’t hear the low-level leading edge of attack transients and the subsequent musical dynamics of the sound as it was originally played. Acoustic distortion in the playback environment is not about tones it’s about not keeping up with the rapid variation in the loudness of the tones, dynamic distortion.
The test for accurate variation in loudness, amplitude modulation, is an acoustic modulation test. This then is also the test for dynamic distortion in playback rooms. But first let’s review the basic electronic tests for harmonic distortion.
Sweep Test for Harmonic Distortion in Audio Gear
The top curve is the FRC of a speaker output. The next curve down is Total Harmonic Distortion produced by the test tone sweep as it passes through the equipment. Below the THD response curve are shown the first 6 Harmonic Distortions, HD response curves.
This set of response curves illustrates the existence of self-induced harmonic distortion present in the output of an applied test signal. These self-induced noise signals, sometimes audible, lie 30 dB and more, well below the FRC of the audio unit.

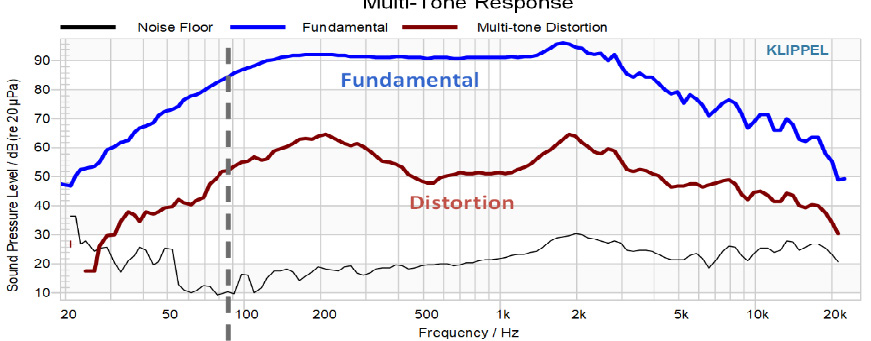
Multi-Tone Test for Harmonic Distortion in Audio Gear
The multi-tone test is another way to reveal harmonic distortion. It isn’t a sweep test but a single noise burst, composed of many single tone bursts played at one time. It is a faster test than a sweep test. The upper envelope that outline the peak loudness of each of the multiple tone bursts is the frequency response curve. The noise floor is lowest noise band and between then is the mid-level band of self-induced noise, total harmonic distortion.

Below are the three response curves from a different multi-tone test. Here we see the upper envelopes of the three signals, The fundamental envelope is the frequency response curve, the distortion is THD and below is the background noise floor.
Interstitial Noise used in Multi-Tone Testing
Multi-tone testing is not a continuous test but comprised of multiple simultaneous individual tests. It is instructive to realize that that the Multi-tone THD noise floor is measurable only between adjacent tones of the Multi-tone signal. It can’t be actually be measured at any of the fundamental multi-tone frequencies because each of the tone burst test frequencies are about 30 or more dB above the self-induced harmonic distortion response signals, the THD.

On the left is sketched the output sound levels developed from applying a set of test tone bursts to a piece of audio equipment. The upper envelope of these form the FRC for the audio equipment. The middle graph adds the self-induced noise spectrum developed during the multi-tone test. This e combined output signal is sent to a spectrum analyzer whose display is seen here. It shows at the same time the output tone bursts FRC and the self-induced THD, Total Harmonic Distortion response curve.
The right-hand graph illustrates the actual measured spectrum of the THD, which is segmented, not continuous. It is not defined at the multi-tone test frequencies; it is an interstitial measurement, only defined between the multi-tone test frequencies. Each test tone response is so loud that it dominates the self-induced noise response data at that frequency. The self-induced THD is only available as an interstitial measurement which extrapolated across each of the test tone frequency.
This test result feature, where the self-generated noise floor appears as an interstitial event, only definable between the test tones, will be seen again as a combo sweep/multi-tone test is used to reveal the Acoustic Distortion of sound in listening rooms.
Perceived Harmonic Distortion
What sound measures like is not always what it sounds like. Psychoacoustics describes the difference. If a set of frequencies at the same sound level are presented to listeners, not all the different tones will sound equally loud. This is captured in the Fletcher-Munson Curve. We, the listeners do not hear different frequencies at the same loudness. Sometimes the harmonic levels are adjusted according to their perceived loudness, in contrast to their measured dB level.

Hybrid Sweep/Multi-Tone Test delivers Dynamic Distortion Response Curve
The Multi-tone test occurs all at one time. The Frequency Sweep test occurs over a period of time. The time of the sweep depends on the sweep rate and the bandwidth of the test. A gated sweep test produces the one-time multi-tone test results by taking data over a period of time. This gated sweep test is the basis of the presently discussed MATT version of testing for distortion in listening rooms.
Gated Sweep Tone Bursts
The test signal is a set of gated tone bursts. There are 8 tone bursts per second. Each burst lasts 67ms and is spaced 67ms apart from the next tone burst. Each adjacent tone burst is 2 Hz higher or lower from its adjacent burst.
The tone burst is not exactly a “tone burst”. It is created with a gated slow sine sweep, which means its tonal frequency changes by 1 Hz during the tone burst. Here the tone runs about 8 cycles in 1/16th second, which is about 128 Hz, close to an octave below middle C (252 Hz).
Here is the sound level of the same test. There is 1/16 sec tone burst followed by 1/16 sec silence, delivering 8 tone bursts per second. It is an idealized version of the 8 Hz gated signal with 50% duty cycle.
This is an actual display of 16 tone bursts over a 2 second time period. There is 60 dB between the peak of the burst and the noise floor. Because of the slew rate of the dB circuit, we do not see vertical level shifts, we see a rapid but not vertical raise in level and a rapid but not vertical drop in level. Note that if the tone burst dropped to 60 dB, the electronic noise floor, we would see a short section of flat level at the bottom between bursts.
But the dB circuit isn’t fast enough to drop 60 dB in about 30ms. That would amount to a settling rate of 2000 dB/sec. But considering we are testing room acoustics having a 30 to 40 dB rise and fall time is fast enough to track room acoustics. Over this 2 second segment the sonic frequency range carried by the 8 Hz tone burst rate changes by 32 Hz.


Modulation Level
The modulation level in dB is defined here. It is the difference between the peak sound level and the lowest adjacent sound level. The modulation level dB divided by 20 dB equals the % modulation.

Perceived Modulation
In room acoustics the self-induced distortion is due to early reflections and reverberation, Running Reverb fills in the quiet time between rapid tone bursts. This infilling reduces the instantaneous dynamic range available to the listener. It also creates a running noise floor that is 5 to 10 dB below the direct signal which tends to mask low level detail in the music.
The perceived dynamic range is what matters, not the absolute dynamic range. For human listening, the perceived dynamic range is 20 dB at a burst rate of 8 Hz. The first 7 dB is proportional to the % modulation, but above, humans start losing sensitivity to modulation and the modulation sensitivity curve flattens right out at 20 dB. A 30 or 40 dB SNR modulation still sounds like it is a 20 dB SNR modulation.
8 Hz Gated Burst Rate
The idea of testing an audio system to deliver a set of gated tone bursts seems reasonable. But why choose the 8 Hz gated tone burst as the standard of reference? This is related to speech intelligibility testing, particularly the RASTI technique produced by B&K.
RASTI, Rapid Speech Transmission Index, is a “perceived articulation” measurement based on modulated noise of different bandwidths and different modulation rates’ between 4 and 12 Hz. It uses a sine shaped modulation, not a square wave shaped modulation as done here with the tone bursts.
The present modulation test, MATT, was developed for music articulation and is based on 8 Hz modulated tones. The modulation rate of 8 Hz was based on studies that showed 8 Hz to be fastest average separate distinct sonic event production rate worldwide, produced by humans in music, song or speech.
The 50% duty cycle 8 Hz modulation rate is equivalent in terms of music theory to staccato 1/16th notes at 120 BPM. This is 480 staccato notes/minute, which is 8 staccato notes per second. A staccato note is a short note. It is played only during the first half of the note leaving the second half of the note in silence.
Interstitial Dynamic Distortion
In testing for Dynamic Distortion, we are not evaluating the tonal aspects of sound and music, we are only evaluating the temporal aspects of sound and music.
Interstitial distortion is the noise between the signal pulses. Shown are 4 tone bursts of the signal itself and in the frame above is the sound level variation in the test signal. It has a sharp rise and turn off.
Each tone burst is 2 Hz different from another. There is a 40 dB difference between the signal level and the interstitial noise floor, a 40 dB S/N, signal to noise ratio.
In most cases the interstitial noise is a result of the tone burst itself. Here we see the tone bursts of the test signal. The tone is about 130 Hz and the 4 bursts are shown in a 0.5 sec window.
This is the same signal that would be delivered to headphones. Nice and clean sequence of tone bursts with no interstitial noise. It would be what is measured at the cone of the driver.
In the next case the same signal is being delivered to a loudspeaker in a room. The mic position could be one foot in front of the speaker, or it could be at the listening position in a pretty good room.
The S/N ratio is close to 15 dB which normally produces very good dynamic clarity for a listening room. This interstitial noise is an echo that is 12 dB below the direct sound with a 90ms delay, as if the rear wall was 40’ behind the listener. It would be distinctly audible and bothersome.
Next, the same 4 tone bursts and the dynamics are definitely turning into noticeable blur. The leading edge of attack transients are no longer abrupt or audible as they are masked by interstitial noise lingering from the prior burst.
The adjacent tones are co-mingling, and the dynamics are rounded. This lightly conditioned listening room has a S/N ratio of 7 to 10 dB.
This last frame shows the same 4 tone bursts in a very reflective, unconditioned listening room. environment. The early reflections and reverb are so strong that the tone burst sequence is unrecognizable and inaudible. They modify the tone burst itself as well as spill into the dwell time between bursts.
Look at the signal at the time of the first tone burst. There isn’t one. This level of signal modulation about 3 dB and has no correlation to the direct signal.
What is important to realize as that within this gargling kind of sound we are still hearing each tone that the speaker is playing. It’s not that we don’t hear the tone, it’s that we lose track of when the tone is playing.
What’s instructive with this “gargling” kind of sound is that all the frequencies, the tones we are supposed to hear, the ones being played by the speaker and heard at the listening position. It’s just that they have lost their dynamic presence. Each note blends into the next note which makes a continuous babbling kind of sound. Dynamic distortion is what ruins music listening in listening rooms.


MATT (Music Articulation Test Tones)
Next is shown the 1980’s version for developing modulation the test results. A gated sine sweep signal is recorded onto a CD. It is played through speakers in a listening room and a recording is made at the listening position. The recording is then run through a sound level strip chart recorder to create a sound level vs time record of the sound level variations at the listening position, the audible dynamic range for rapid tone bursts. Here is a schematic of the test setup.

 The B&K 2306 sound level strip chart recorder delivers test results. Paper and pen speeds are adjusted to produce a legible report.
Sweep signal lasts 90 seconds and paper speed at 3mm/sec produces a 27 cm long test chart. Paper speed can be increased to 1mm/sec and again to 30 mm/sec to increase the time scale which allows more detail to be examined.
Response curve for gated tone sweep. Here we see what the test signal looks like when run directly into the chart recorder. The signal is a 20 dB variation between 37 and 47 dB. The sweep starts on the left at 20 Hz, ascends to 780 Hz midpoint, reverses, descends back down to 20 Hz on the right. Linear sweep rate 16 Hz/sec lasts 90 sec. Second chart shows % dB signal modulation based on 20 dB being 100% of the audible dynamic range at 8 bursts/sec.

Below is the same signal heard at the listening position in a reverberant room. Above 300Hz, the dynamic range in treble is 2 dB which leaves music sounding totally garbled. In the bass range, flexing windows and walls let some bass leak out of the room reducing the reverb buildup allowing up to 5 dB of dynamic range.

Second Generation Testing
Later, in the mid 1990’s much of the test results were done using a Nicolet 446A. It delivered a larger and more detailed version of the test results, and it was easier to operate than the field chart recorder previously used.
Here is shown the spectrum of the test signal. The vertical axis is in 10 dB increment and the horizontal axis is the 0 to 100 sec time scale. The linear frequency sweep is also plotted.
This is the full-scale version of the test signal. By expanding the time scale the details of each tone burst can be seen.
The middle dark region is the result of a fixed “pen” width overlapping adjacent lines.
The upper envelope if traced would be the FRC of the room and the lower envelope outlines the self- induced noise level, also called Running Reverb. Between the two is the amplitude in dB of sound level response to the tone bursts.
The strength in dynamic variation comes and goes but for the most part remains in the range of 20 dB. This is the type of room response we see in professionally developed recording studios.
Next graph is of a well-conditioned listening room. A number of sound cancels are visible. In general, the upper level of the sound peaks are fairly uniform.
The upper envelope would be the frequency response curve at the listening position in the room. The lower envelope would be running reverb response curve. The difference between these two curves at any given frequency is the level in Dynamic Distortion in dB.
12 Here we have the gated sweep response curve of a bare room. It’s the same room as the one above without the acoustic conditioning.
The thinness of the vertical part of the graph shows a low level of modulation, especially in the bass range where there is essentially no modulation. The gated sine sweep in the bass range has so little modulation that it sounds like a standard frequency sweep.


Current Version for Testing
The hybrid Swept/Multi-Tone test signal is played into the room. This MATT test, Musical Articulation Test Tones, is symmetric about 780 Hz and is a linear (not log) gated frequency sweep. A recording is made at the listening position and played back through the MATT test analyzer, a MATLAB program.
The resulting sound level vs time chart as shown below is the basis for evaluating Dynamic Distortion caused by passing the test signal through the listening room. This print out is similar to the original Multi-Tone Response graph, displayed above.

The test tones are 2 Hz apart. Test begins at 20 Hz ascends to 780 Hz then reverses back down to 20 Hz. It is comprised of 760 individual tone burst test responses which are seen as closely spaced vertical lines. Each test tone burst lasts 67ms, (1/16th sec) and is separated from the next test tone burst by 67 ms during which the residual noise can be measured. This is an interstitial tone burst noise test.
The upper envelope of the tone burst test outlines the FRC of the room. The lower envelope of the bursts outlines how quiet the room gets between each pair of test tone bursts. It is the response curve for the self-induced noise caused by the tone bursts.
Upper and Lower Envelopes
Below is shown the upper and lower envelopes of the same acoustic sweep/multi-tone test. The upper envelope outlines the sound level of each tone burst, the FRC of the room. The lower envelope outlines the residual noise level between each burst. This graph is similar to the second version of multi-tone testing shown above, except that the background noise floor, typically some 50 to 60 dB down from the reference listening level is usually not measured by this test.

The lower envelope of the MATT test outlines in terms of room acoustics what is found in the third, the right-hand graph in the above section, Discussion of Multi-Tone Testing. The noise response curve. In both cases, it is a self-induced noise level is only detectable between adjacent tone bursts.
Below is an expanded view of the above gated sweep test. It has the same vertical scale but horizontal frequency scale has been expanded by a factor of x15, showing the first 100 Hz, between 20 and 120 Hz. The upper envelope of this curve is flat withing 3 dB, which is very flat for a room response curve, especially in the bass range.
A series of low frequency tone bursts created this sound level chart at the listening position. This is essentially the room acoustic version of the Multi-tone display for amps. Multi-tones happen all at one time whereas here, each tone of the multitone occurs separately from the other tones, one at a time instead of all at once. The frequency of each tone burst is 2Hz above the previous burst. The burst rate is 8 bursts a second with a 50% duty cycle. It plays a tone for 1/16th second and is off for 1/16th second. Because it is a sweep tone, the frequency glides 1 Hz during each burst.

The signal sequence is 0.625 sec tone burst followed by a 0.625 sec of silence. Notice that immediately following each tone burst is a silent period. But the silence isn’t very silent. Here in the bass range the running reverb ranges between 5 to 15 dB below the loudness of the direct signal. Its existence is only apparent between each of the tone bursts, as it is in the Multi-tone test for harmonic distortion, but in this case it’s dynamic distortion.
14 If we imagine the upper and lower envelope of this graph we will see a tracing of pair of lines starting 5 dB apart at 25 Hz, expanding to 10 dB at 50 Hz and to 15 dB at 100 Hz. The difference between the tone burst peak and the running noise floor which is an excellent SNR in room acoustics.
One might expect the self-generated SNR remains constant regardless of loudness. But this is not the case, loud sound bursts stimulate windows, walls, doors and cabinets into sympathetic vibration where at lower levels they are not. It’s called room break-up, and it is not unlike speaker cone break-up. It is the limit as to how loud the room can be played. The SNR drops when room break-up is going on.
Gated Burst Rate
The idea of testing an audio system to deliver a set of gated tone bursts seems reasonable. But why choose the 8 Hz gated tone burst as the standard of reference? This is related to speech intelligibility testing, particularly the RASTI technique produced by B&K. RASTI, Rapid Speech Transmission Index, is a “perceived articulation” measurement based on modulated noise of different bandwidths and different modulation rates’ between 4 and 12 Hz. It uses a sine shaped modulation, not a square wave shaped modulation as done here with the tone bursts.
The present modulation test, MATT, was developed for music articulation and is based on 8 Hz modulated tones. The modulation rate of 8 Hz was decided upon based on the fact that 8 Hz is the fastest average separate distinct sonic event production rate worldwide, produced by humans in music, song or speech. The 8 Hz 50% duty cycle modulation rate is equivalent in music theory terms to staccato 1/16th notes at 120 BPM. This is 480 staccato notes/minute, which is 8 staccato notes per second. A staccato note is a short note. It is played only during the first half of the note leaving the second half of the note in silence.
SNR and Musical Quality
Acoustic Sweep/Multi-Tone testing reveals the instantaneous signal to noise ratio at the listening position. It is the difference in dB between the direct sound level and the simultaneous reverb level. The SNR response curve is related to a musical quality response curve in that low levels of SNR produce dynamic blurring in the fluctuations in the sound levels of music. to background noise floor, where the SNR varies with the loudness of the direct signal. We are considering an SNR that remains constant as the loudness of the signal is varied.
 The gated sine sweep version of the multi-tone provides a test/evaluation environment that is not available by either the harmonic sine sweep or the broadband multi-tone versions of determining the “running” or self-generated noise floor.
The gated sine sweep delivers a multi-tone where each tone is separated not only in frequency but in time. We measure the amplitude of a tone during one time period and the amplitude of the residual tonal noise from a different tone during another time duration.
The musical quality issue comes in as the dB difference of the reverb level and the two adjacent multi-tone bursts that bracket the reverb. This is very similar to (non FFT) early speech intelligibility testing equipment developed by B&K with their RASTI testing system (Rapid Speech Transmission Index) in the early 1980’s. It is based on the MTF Modulation Transfer Function, similar to the MATT system.

On the left is the electronic level of the test signal with a 60 SNR. The tone burst rate is 8/second. At 8 Hz, the perception threshold of tone burst sensitivity is about 20 dB, a larger SNR still sounds like 20 dB. A 10 dB sound level variation is clearly heard. A 3 dB level variation is essentially undetectable, the tone bursts are slurred together, blurred into a slight warble.

If the dB level of the self-induced noise lingering between adjacent tone bursts 15 dB, the listener perceives excellent articulation, dynamic clarity. Good dynamic clarity means the lingering noise floor is so low that the listener can clearly hear the low level characteristics the next attack transient.
Musical Clarity in Small Rooms
In performance halls Clarity is defined as the S/N ratio where the Signal is defined as the acoustic energy in the first 50ms of an impulse decay and Noise is the remaining energy. This is based on the reflections being diffusive.
It doesn’t apply in small listening rooms because the diffusive condition of reverb only exists in the upper treble range. The Schroeder frequency delineates between the higher frequency condition of diffusive energy distribution and the modal reverb condition in the mid and bass ranges. In the small room this dividing band is in the upper treble range.


Here is shown the Schroeder frequency range where measuring Clarity does not hold. Yet, most people hear music in small rooms. Clarity, being the separation between sounds and silence in music is still the mark of a good performing room.
In small rooms the concept of clarity is still to be able to hear the consecutive quality of musical sounds. When a small room is too reflective/reverberant the fast paced sequence of musical sounds blurs together. The early reflections still bolster the strength of the direct signal as do stage house reflections in the concert hall. In larger halls when the direct sound shuts off it is followed by the relatively quiet levels in the decay and reverberation levels of the hall.
But in small rooms, when the same direct sound turns off, the early reflections, early reverberation and late reflections are so loud that the separation or distinctness of separate notes is lost. Sound becomes blurred in time. The tone is loud enough but the separation between tones is not distinct enough. An acoustically dead room would resolve this problem but is isn’t a habitable environment. Following the lead of Clarity in concert halls a related test, less abstract and more tactile, was developed.
A rapidly gated set of tone bursts played in the listening room allows the sound level of the Direct + Early reflections to be compared to the lingering sound level that exists immediately following Direct being turned off. The MATT test measures the S/N Signal to Noise ratio for a continuous set of tone bursts. The sound level achieved during a 62 ms tone burst (direct + early reflections) is compared to the lingering noise level during the following 62 ms. This is an interstitial noise test, similar to the Multi-tone test except the bursts are separated not only in frequency but in time by the gated sweep burst rate.
Dynamic Distortion in Small Rooms
Where does Dynamic Distortion come from? The classic idea is that early reflections add to the direct signal of a sound to increase the perceived sound level. Late reflections are bothersome and interfere with hearing the next sound.
 In the MATT test the direct signal lasts 62ms which is long enough for dozens of early reflections to take place which add to the direct signal. When the direct shuts off, what is heard and measured is the decay of the early reflections and “early reverb. Most of us are familiar with reverberation but what is “early reverb”?
The speaker plane is located in the front of the room between parallel surfaces, side/side and floor/ceiling. Parallel surfaces efficiently reflect sound back and forth between each other. Stand behind a speaker in a typical room and clap your hands over the top of it. Hear the tap tap tap of the flutter echo, the repeating side/side and floor/ceiling reflections. Perpendicular reflections last longer than other reflections. Add carpet and a couple sound panels to calm down the flutter echo.
 The mids and bass also expand away in the plane of the speaker (except for dipoles) and bounce between the parallel surfaces. Although the mid/bass flutter also lasts a long time we don’t hear it as a sharp tap tap tap because the tone burst lasts much longer than a hand clap. It has at least 3 or 4 periods. At 200 Hz, it needs a 20 ms tone burst. The 62ms burst covers the bass range.
All of the sound moving in the plane of the speakers bounces between the parallel surfaces and stays in the plane of the speakers. Some of it will have the right timing to create modes. The rest continues along the same path as well. This stored energy in the front of the room is the early reverb and the expansion of sound away from this section of stored energy creates the effect of Dynamic distortion is the decay of Early Reverb as it lingers and backfills what is supposed to be the quiet time between gated tone bursts. It blurs them together into a garbled version of sound, as it does with music. Adding mid and bass range acoustic conditioning, on the side/side and floor/ceiling surfaces in the plane of the speakers eliminates the reflections that cause this form of acoustic distortion in listening rooms.
Addendum
Excerpt from Sound on Sound review of NS-10s by Phil Ward, speaker/amp reviewer since 2000
“A frequency-response curve appears to tell you if a monitor is going to reproduce different elements of the audible bandwidth at the same level, which intuitively seems vitally important. But a simple frequency-response curve tells you no such thing, and the psychoacoustics of human hearing is more about the time domain than the frequency domain. We humans have evolved to respond more to the transient than to the tonal elements of sound. Try a little experiment: find a sample of something like a clarinet and a flute, each playing the same continuous note, drop them onto two tracks in your DAW and listen to them in turn. It’s very easy to tell which is which.
Chop the first, say, 500ms from the front of each so that the characteristic beginnings of the notes are suppressed, and listen again, they’ll sound much more similar: the brain uses the characteristic transients to differentiate the instruments, and without them it struggles.
Now, go back to the un-edited samples and apply a severe EQ to each and listen again: despite the EQ, you can still differentiate them. A similar illustration of the use the brain makes of transient rather than tonal information is that a familiar voice remains familiar in wildly different acoustic environments — environments that imprint different tonal characters on the sound.
So, concentrating on the ‘flatness’ of frequency response is to miss a hugely important point:
if a monitor handles transients accurately, its frequency response is much less important than you probably think.”


