Studio performance…Yes, FFT analysis has gotten pretty inexpensive since those early days in the mid 1980’s when we had to buy the Crown Techron 12 or 20 for something well over $10k…but regardless of when or how much it cost, once you have the FFT analysis, then what? Read along as Art Responds to Studio Performance Questions.
 If the FFT waterfalls look smooth and fast, does that mean the studio sounds good?
If the freq response measures pretty flat, does that mean your mix will hold together?
What is the connection between the output of FFT analysis and being able to mix a record? Isn’t that the bottom line?
In our world of TubeTraps, we have continuously worked on recording studios since 1985. We tried to connect the dots between FFT printouts and studio performance but we ran into major problems. In particular the uncertainty principle wiped our efforts at FFT analysis out. It’s the old dF x dT = 1 problem. In the deep bass range, say below 100 Hz, lies the first two octaves of sound, which is where most of the hard to solve, real problems in room acoustics are found.
FFT loses resolution down in the low octaves and the FFT printouts begin to become almost useless. We want to see a narrow bandwidth, say 2 Hz wide in the deep bass range and we want to see the response of the room with a resolution of at least 1/8th second. Here’s the rub. For dF = 2 Hz, we have dT = 1/dF = 1/2 = 0.5 seconds resolution and we wanted 0.125 seconds resolution. Here’s the flip side of that problem…we want 1/8 second resolution and our frequency resolution ends up being dF = 1/dT = 1/(1/8) = 8 Hz.
Wow, we are looking into the first octave, between 20 and 40 Hz and there is 12 notes in that octave which is 20 Hz wide. Each note is about 20/12 = 1.7 Hz apart. The 1/8th second resolution gives us a frequency resolution of about 8/20 = 1/3rd octave. Another way to put this is that a bandwidth of 8 Hz includes about 8/1.7 = 5 notes out of the 12 that makes up that octave. So FFT produces nothing but smeared data in the deep bass range: Time smeared or frequency smeared, take your pick, but you can’t have both in the deep bass region, which is where all our lumpy bass problems lie. All this happened to us very early on and by 1989 we gave up on FFT as being a useful tool for deep bass exploration.
So then what? We discovered the magical world of MTF, Modulation Transfer Function, testing. It measures how fast your room is. It sort of measures how loud your room gets during a very short tone burst and how quiet your room gets during a very short window of silence which immediately follows the tone burst. It measures how quickly a sound level can change in your room. It turns out that engineers and other golden ears are much more interested in the high speed dynamic nature of the room, much more than its frequency response, when it comes to performance.
Here’s an example to think about. You take a flat gated frequency response signal and play it into a speaker with a flat frequency response and set the speaker up outdoors or in an anechoic chamber. You mic the result and see a flat frequency response and you also see a very dynamic modulation response. The sound level difference between tone burst level and silence level in the signal may be 60 dB. Your mic’d signal also shows a sound level difference of 60 dB between what it sees when the tone burst is on and when it is off. You measure a flat frequency response along with a dynamic modulation response.
But next we take the same speaker and put it into a reverb chamber, where the RT60 is about 15 seconds. We play the MTF signal and measure what we hear in the reverb chamber…..We again measure a very flat frequency response, because the reverb chamber has a very low, flat absorption coefficient response curve. But when it comes to the dynamic test, we register Zero dB modulation. The musical or tonal dynamics when played in a reverb chamber all blur together. So in one case we get a flat frequency response curve and deep frequency modulation response curve while in the other case we still get a flat frequency response curve but have a zero modulation response curve.
The modulation part of the response curve conveys the “intelligibility” component of the signal. Anyone can hear a tone, but what matters is the ability to hear rapid variations of the tone level. The better you can hear the dynamics in the music, the better you will be able to mix the music you are listening to.
See more about the MTF version of room testing, what we call the MATT test. Read about how the MTF test measures a quality of sound called musical clarity.
For a preview….Instead of a slow sine sweep test signal used for the FFT, a modulation test uses a rapidly gated or tone burst version of a sweep signal. It might play 28 Hz for 1/8th second, and them be silent for 1/8th second, then change frequency. It would play 29 Hz for 1/8th second and be silent for 1/8th second, and then change frequency again. This produces a rapidly gated sweep tone burst. And the real question of concern in performance testing of a control room is to determine the high speed clarity of the room. What frequencies dynamically blur together and which ones are perfectly clear. A regular untreated room will produce 3 to 5 dB modulation at a tone burst rate of 8 Hz or bursts per second. A mildly treated room improves things to maybe 5 to 10 dB. A perfect recording room will be delivering 15 to 20 dB modulation throughout the first 5 octaves of sound. Any stronger modulation than 20 dB is not worth much because the threshold limit for humans to perceive modulation level changes in the 8 Hz region is 20 dB. A 30 dB modulated signal sounds the same as a 20 dB modulated signal while a 20 dB modulated signal does sound better than a 15 dB modulated signal.
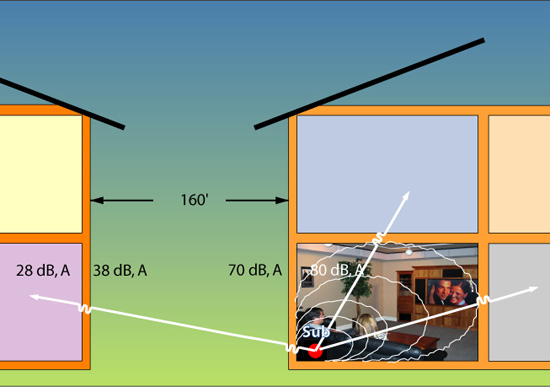
There is so much to the science and art of testing the MTF of a room that I refer you to website locations instead of trying to convey that information here, in the present venue. In large room acoustics the MTF type testing appears as a speech intelligibility test, %ALCONS or AI (articulation index). RASTI is an actual MTF test, designed to measure the perception of amplified speech in large rooms. MATT is also an MTF test, designed to measure the perception of amplified music in small rooms.
Welcome to the new world of MTF room performance testing, where flat response curves have essentially nothing to do with how intelligible or clear sounding the room is. And, where excellent mixes are shown to come out of clear sounding dynamic rooms, not flat response curve rooms.